empty
 
 
27.09.2024 10:47 AM
EUR/USD and GBP/USD: technical analysis on September 27, 2024

EUR/USD

This image is no longer relevant

Larger timeframes

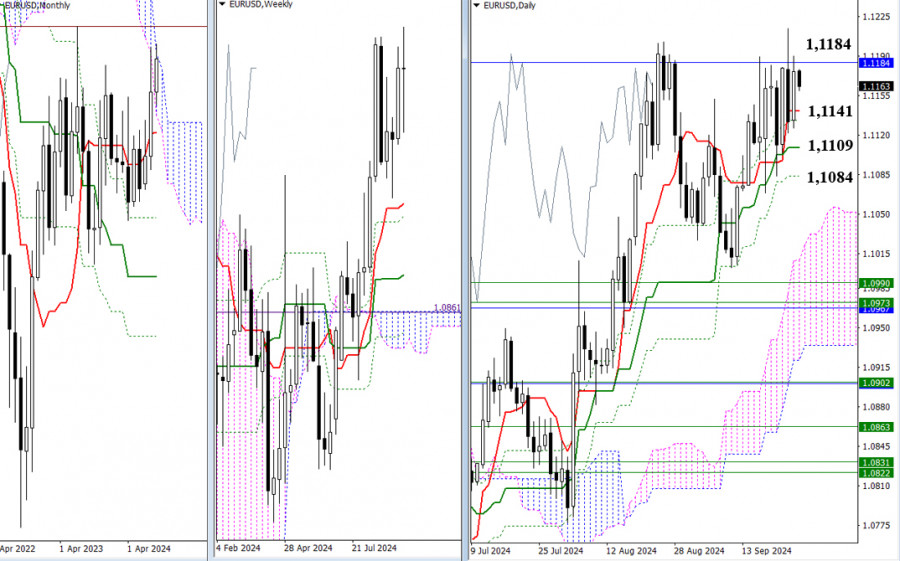
This week, the EUR/USD pair has been consolidating below the upper border of the one-month cloud (1.1184). Bearish traders have managed a few times to destroy all of their opponents' gains, bringing the price back to the short-term daily trend channel. As a result, the consolidation range and the current uncertainty can now be defined by the one-month resistance at 1.1184 and the support levels of the daily Ichimoku cross (1.1141 – 1.1133 – 1.1109 – 1.1084). If the instrument breaks out beyond these levels and firmly settles outside these borders, this will open up new prospects for EUR/USD.

This image is no longer relevant

H4 – H1 timeframes

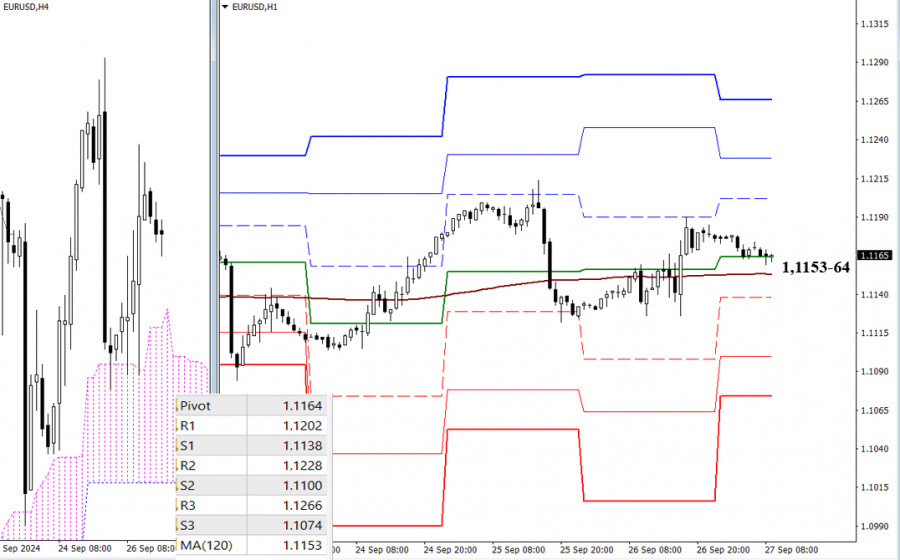
On the lower timeframes, key levels of 1.1153 – 1.1164 (the central pivot level of the day + the weekly long-term trend) remain horizontal, maintaining uncertainty. The instrument is fluctuating above and below these levels, winding around the trend line. If a directional movement develops, attention will shift to other reference points on the lower timeframes. In the case of an upward move, the resistances of the classic Pivot levels (1.1202 – 1.1228 – 1.1266) will be of interest to bulls. If the EUR/USD pair declines, the classic Pivot level supports (1.1138 – 1.1100 – 1.1074) may come into play.

***

GBP/USD

This image is no longer relevant

Larger timeframes

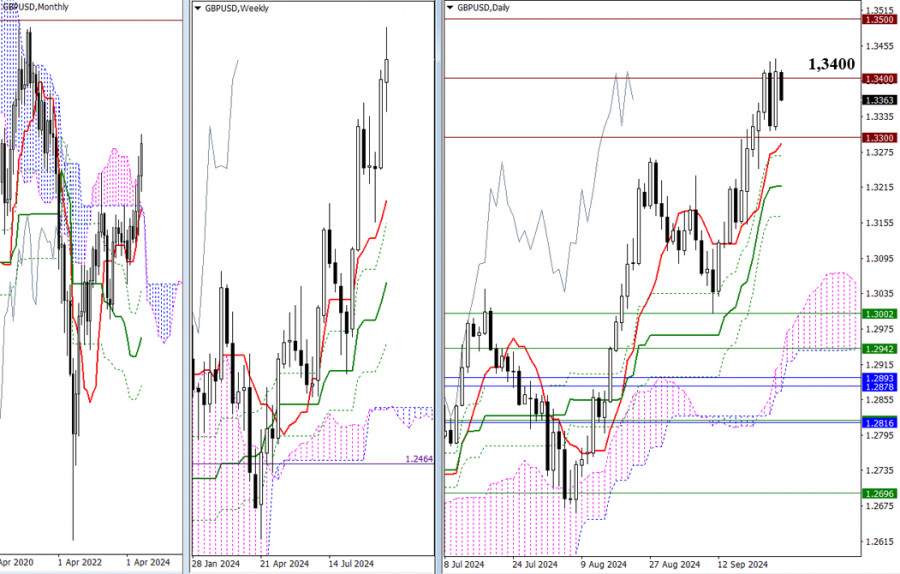
As the week is coming to an end, the market is still struggling to decide on the 1.3400 level. A breakout of this level will pave the way for new bullish prospects, potentially driving the price toward the next psychological resistance at 1.3500. A rejection will bring the price back to the previous level of 1.3300, followed by testing the supports of the daily Ichimoku cross (1.3289 – 1.3217 – 1.3166). Let's wait for the week's close to see which trading force secures the advantage, though uncertainty may prevail at this stage.

This image is no longer relevant

H4 – H1 timeframes

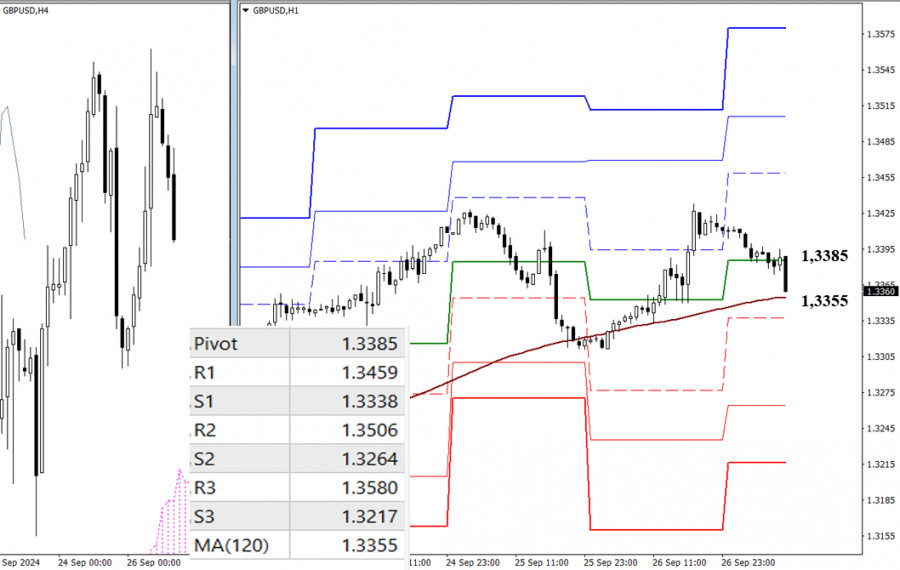
On the lower timeframes, the market is descending toward key support levels, located today at 1.3385 – 1.3355 (central Pivot level + weekly long-term trend). Control of the trend provides the primary advantage. Additional intraday reference points are the classic Pivot levels, meaning an upward move would pass through resistances (1.3459 – 1.3506 – 1.3580), while a downward move would go through supports (1.3338 – 1.3264 – 1.3217).

***

This technical analysis is based on the following ideas:

Larger timeframes - Ichimoku Kinko Hyo (9.26.52) + Fibo Kijun levels

H1 – classic pivot points + 120-period Moving Avarage (weekly long-term trendline)

Evangelos Poulakis,
انسٹافاریکس کا تجزیاتی ماہر
© 2007-2024
انسٹافاریکس کے ساتھ کرپٹو کرنسی کی معاملاتی تبدیلیوں سے کمائیں۔
میٹا ٹریڈر 4 ڈاؤن لوڈ کریں اور اپنی پہلی ٹریڈ کھولیں۔
  • Grand Choice
    Contest by
    InstaForex
    InstaForex always strives to help you
    fulfill your biggest dreams.
    مقابلہ میں شامل ہوں
  • چانسی ڈیپازٹ
    اپنے اکاؤنٹ میں 3000 ڈالر جمع کروائیں اور حاصل کریں$3000 مزید!
    ہم ستمبر قرعہ اندازی کرتے ہیں $3000چانسی ڈیپازٹ نامی مقابلہ کے تحت
    اپنے اکاؤنٹ میں 3000 ڈالر جمع کروانے پر موقع حاصل کریں - اس شرط پر پورا اُترتے ہوئے اس مقابلہ میں شرکت کریں
    مقابلہ میں شامل ہوں
  • ٹریڈ وائز، ون ڈیوائس
    کم از کم 500 ڈالر کے ساتھ اپنے اکاؤنٹ کو ٹاپ اپ کریں، مقابلے کے لیے سائن اپ کریں، اور موبائل ڈیوائسز جیتنے کا موقع حاصل کریں۔
    مقابلہ میں شامل ہوں
  • 100 فیصد بونس
    اپنے ڈپازٹ پر 100 فیصد بونس حاصل کرنے کا آپ کا منفرد موقع
    بونس حاصل کریں
  • 55 فیصد بونس
    اپنے ہر ڈپازٹ پر 55 فیصد بونس کے لیے درخواست دیں
    بونس حاصل کریں
  • 30 فیصد بونس
    ہر بار جب آپ اپنا اکاؤنٹ ٹاپ اپ کریں تو 30 فیصد بونس حاصل کریں
    بونس حاصل کریں

تجویز کردہ مضامین

ابھی فوری بات نہیں کرسکتے ؟
اپنا سوال پوچھیں بذریعہ چیٹ.
Widget callback