empty
 
 
30.10.2024 03:45 AM
Overview of EUR/USD on October 30; The First Miss in U.S. data

This image is no longer relevant

On Tuesday, the EUR/USD currency pair again showed no significant movement, mostly trading below the moving average throughout the day without attempting to break above it. Even the JOLTs job openings report in the U.S., which was a clear miss, provided little support as the dollar pulled back slightly from its local highs.

Regarding the JOLTs report, several points can be made. First, it's published with a significant delay from real-time data. For instance, yesterday, we saw figures for... September. Two-month-old data is unlikely to drastically shift market sentiment toward the U.S. dollar. At the same time, it's worth noting that the market used to respond differently. The dollar was previously sold off on any report or news—even without such. Now, the situation is the reverse.

We've discussed and explained this paradox. For the past two years, the market has focused heavily on the anticipated easing of Federal Reserve monetary policy, disregarding other news and the actual economic conditions in the U.S. and EU. Market participants were fixated on selling the dollar, leaving other factors aside. After September 18 (as we anticipated), the situation reversed. The Fed's easing was fully or nearly fully priced in, and the market rushed to restore the U.S. dollar's fair value while accounting for the European Central Bank's easing, which had previously been overlooked.

Thus, a few months ago, we saw the market ignoring positive news for the dollar, and now we see it ignoring negative news. It's all logical, though perhaps not obvious.

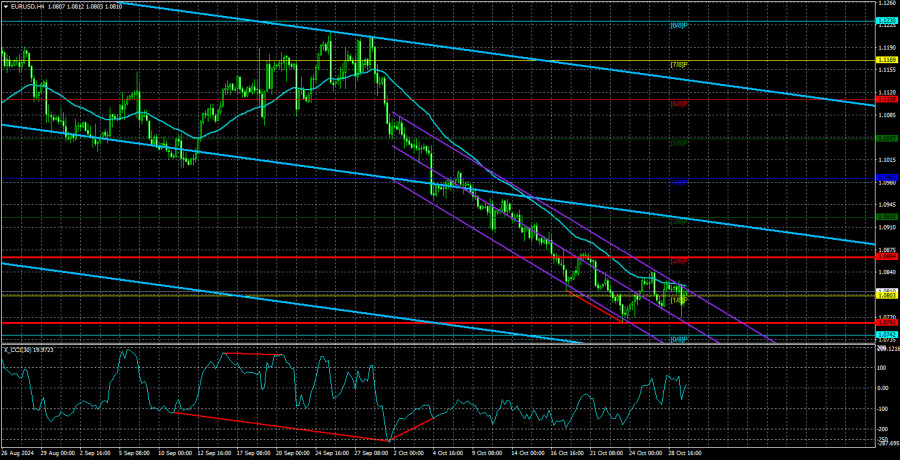
What can we expect from EUR/USD going forward? Considering the pair can't even hold above the moving average, we can expect further declines. Of course, important reports will be released this week in both the U.S. and the EU, which could temporarily shift market sentiment to "bullish." A correction has been anticipated for a few weeks now. However, it's worth reminding readers that the most likely outcome, which everyone expects, often doesn't happen. Markets operate unpredictably. Thus, we wouldn't be surprised if the euro continues its decline from current levels or if we see a brief uptick symbolizing an upward correction. Either way, a classic 50% retracement followed by a resumption of the downtrend is unlikely. We still believe the target at 1.0435 remains relevant and see no long-term growth factors for the euro.

This image is no longer relevant

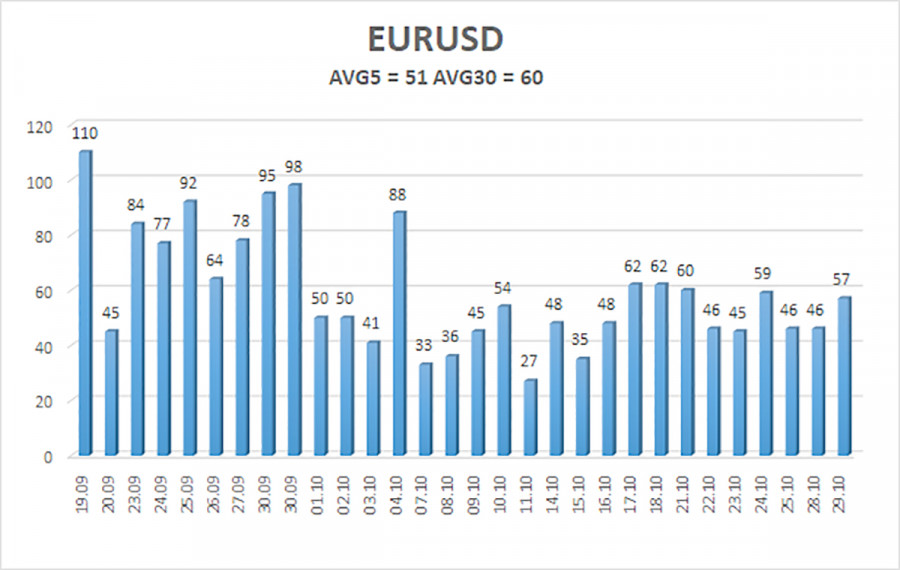
The average volatility of the EUR/USD pair over the last five trading days, as of October 30, stands at 51 pips, considered "low." We expect the pair to move between 1.0761 and 1.0863 on Wednesday. The higher linear regression channel has turned downward, continuing the global downtrend. The CCI indicator has already formed several bullish divergences, suggesting a possible correction. However, this is merely a warning.

Nearest Support Levels:

  • S1 - 1.0803
  • S2 - 1.0742
  • S3 - 1.0681

Nearest Resistance Levels:

  • R1 - 1.0864
  • R2 - 1.0925
  • R3 - 1.0986

Trading Recommendations:

The EUR/USD pair continues its downward movement. For weeks, we have expected only declines from the euro in the medium term and fully support the downward trend direction. The market may have priced in all or nearly all expected Fed rate cuts. If that's the case, the dollar has few reasons left to fall, though there were few to begin with. Short positions can still be considered with targets at 1.0761 and 1.0742 if the price remains below the moving average. If you trade based solely on technicals, long positions may become relevant above the moving average line, although such a break would likely indicate only a correction.

Explanation of Illustrations:

Linear Regression Channels help determine the current trend. If both channels are aligned, it indicates a strong trend.

Moving Average Line (settings: 20,0, smoothed) defines the short-term trend and current trading direction.

Murray Levels act as target levels for movements and corrections.

Volatility Levels (red lines) represent the likely price range for the pair over the next 24 hours based on current volatility readings.

CCI Indicator: If it enters the oversold region (below -250) or overbought region (above +250), it signals an impending trend reversal in the opposite direction.

Paolo Greco,
انسٹافاریکس کا تجزیاتی ماہر
© 2007-2024
انسٹافاریکس کے ساتھ کرپٹو کرنسی کی معاملاتی تبدیلیوں سے کمائیں۔
میٹا ٹریڈر 4 ڈاؤن لوڈ کریں اور اپنی پہلی ٹریڈ کھولیں۔
  • Grand Choice
    Contest by
    InstaForex
    InstaForex always strives to help you
    fulfill your biggest dreams.
    مقابلہ میں شامل ہوں
  • چانسی ڈیپازٹ
    اپنے اکاؤنٹ میں 3000 ڈالر جمع کروائیں اور حاصل کریں$5000 مزید!
    ہم نومبر قرعہ اندازی کرتے ہیں $5000چانسی ڈیپازٹ نامی مقابلہ کے تحت
    اپنے اکاؤنٹ میں 3000 ڈالر جمع کروانے پر موقع حاصل کریں - اس شرط پر پورا اُترتے ہوئے اس مقابلہ میں شرکت کریں
    مقابلہ میں شامل ہوں
  • ٹریڈ وائز، ون ڈیوائس
    کم از کم 500 ڈالر کے ساتھ اپنے اکاؤنٹ کو ٹاپ اپ کریں، مقابلے کے لیے سائن اپ کریں، اور موبائل ڈیوائسز جیتنے کا موقع حاصل کریں۔
    مقابلہ میں شامل ہوں
  • 100 فیصد بونس
    اپنے ڈپازٹ پر 100 فیصد بونس حاصل کرنے کا آپ کا منفرد موقع
    بونس حاصل کریں
  • 55 فیصد بونس
    اپنے ہر ڈپازٹ پر 55 فیصد بونس کے لیے درخواست دیں
    بونس حاصل کریں
  • 30 فیصد بونس
    ہر بار جب آپ اپنا اکاؤنٹ ٹاپ اپ کریں تو 30 فیصد بونس حاصل کریں
    بونس حاصل کریں

تجویز کردہ مضامین

ابھی فوری بات نہیں کرسکتے ؟
اپنا سوال پوچھیں بذریعہ چیٹ.
Widget callback