GBP/USD 5-Minute Analysis
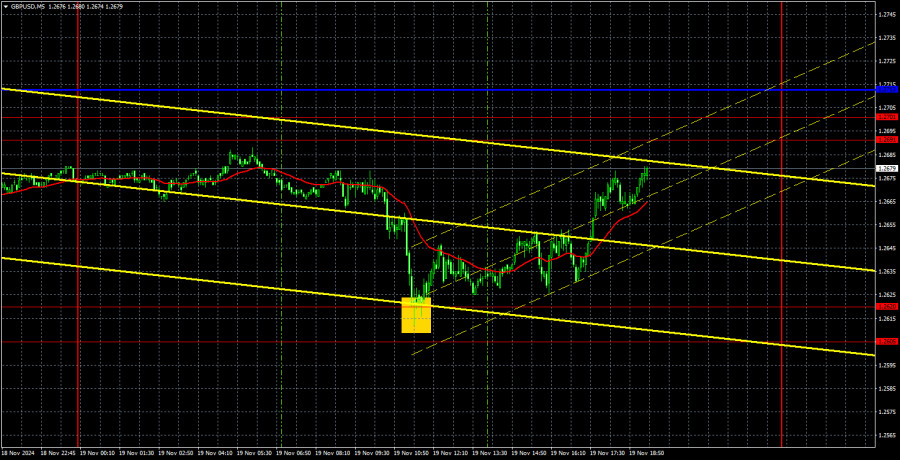
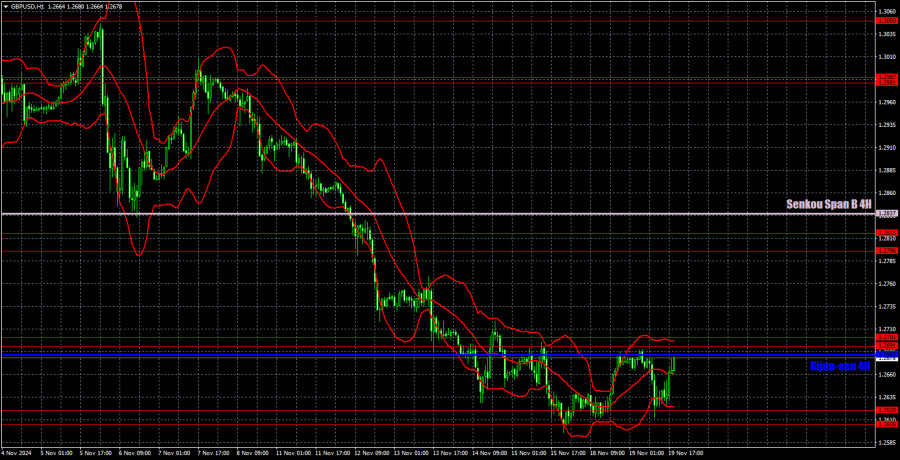
On Tuesday, the GBP/USD currency pair fluctuated up and down. A flat trend is evident in the hourly timeframe, which has formed over the past few days. The price is trading strictly within the range of 1.2605�1.2620 and 1.2691�1.2701. Both major currency pairs have entered a horizontal channel instead of continuing an upward correction. While a correction can still occur after a flat period, the technical picture suggests that the end of the flat trend might lead to a renewed decline in the euro and pound.
This scenario aligns with our expectations, as we anticipate further declines in the euro and pound. The fact that both currencies have depreciated for two months does not imply they cannot continue falling for another two months. For now, rebounds from the boundaries of the horizontal channel can be used to open positions. However, today's inflation report from the UK, the most significant event of the week for the pound, could trigger a strong market reaction. It may also provide insight into whether the pound has any potential for growth over the next two weeks. If inflation exceeds expectations, the pound may gain long-awaited market support. Conversely, another sharp decline could occur as early as Wednesday if inflation falls short.
A single trading signal was formed on Tuesday. The price dropped to 1.2605�1.2620 during the European session and rebounded confidently. Although it was a counter-trend signal, its precision made it actionable. By the end of the day, the price had risen close to the upper boundary of the horizontal channel mentioned earlier. However, trading within a horizontal channel does not guarantee that each boundary will be tested sequentially.
COT Report
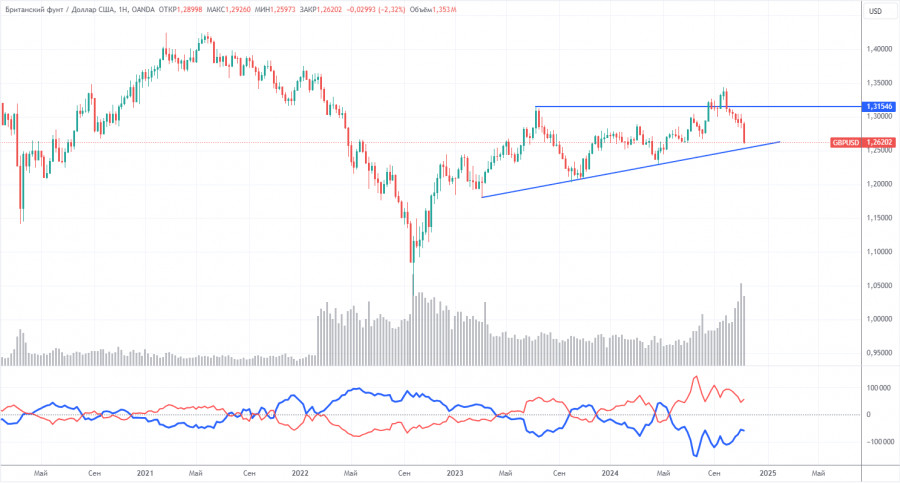
The COT reports on the British pound show that commercial traders' sentiment has been highly volatile in recent years. The red and blue lines representing the net positions of commercial and non-commercial traders frequently intersect and usually hover near the zero mark. The most recent downward trend coincided with the red line being below zero. Currently, the red line is above zero.
According to the latest COT report, the non-commercial group closed 700 BUY contracts and 11,700 SELL contracts. As a result, the net position of non-commercial traders grew by 11,000 contracts over the week. While the market is not rushing to sell the pound sterling in the medium term, the movements of the past six weeks are encouraging.
The fundamental backdrop still provides no basis for long-term pound purchases, and the pound has a realistic chance of resuming its global downtrend. However, on the weekly timeframe, there is an upward trendline. Until this trendline is broken, long-term expectations of a decline in the pound remain speculative. For now, the pound continues to demonstrate significant resilience against the dollar.
GBP/USD 1-Hour Analysis
The GBP/USD pair retains its overall bearish tone on the hourly timeframe. The upward trend has been nullified, so further declines in the pound are expected, both strong and prolonged. The last correction was a flat movement and is now over. A new correction has started, with the 1.2605�1.2620 zone as solid support. However, this movement also appears to be another flat phase. There are still no fundamental drivers for significant pound appreciation.
For November 20, we highlight the following important levels: 1.2429-1.2445, 1.2516, 1.2605-1.2620, 1.2796-1.2816, 1.2863, 1.2981-1.2987, 1.3050. The Senkou Span B (1.2837) and Kijun-sen (1.2682) lines can also be sources of signals. Stop Loss orders are recommended to be set at breakeven if the price moves 20 pips in the intended direction. Note that Ichimoku indicator lines may shift during the day, which should be considered when determining trading signals.
The UK inflation report, regarded as the "event of the week," is scheduled for release on Wednesday. It could provoke significant market reactions during both the European and American sessions. In the U.S., there are no noteworthy events on the calendar for today.
Chart Explanations:
Support and resistance levels: thick red lines around which movement may end. They are not sources of trading signals.
Kijun-sen and Senkou Span B lines: Ichimoku indicator lines transferred from the 4-hour to the 1-hour timeframe. These are strong lines.
Extreme levels: thin red lines where the price previously rebounded. They are sources of trading signals.
Yellow lines: Trend lines, trend channels, and other technical patterns.
Indicator 1 on COT charts: The net position size for each category of traders.


